Remote sensing data can be a bit patchy at times, like the TROPOMI Carbon Monoxide data in Los Angeles during August 2020 when the Bobcat fire was releasing tons (literally) of Carbon Monoxide.
Below is the original geotiff. The peak CO emission in the San Gabriel Mountains.

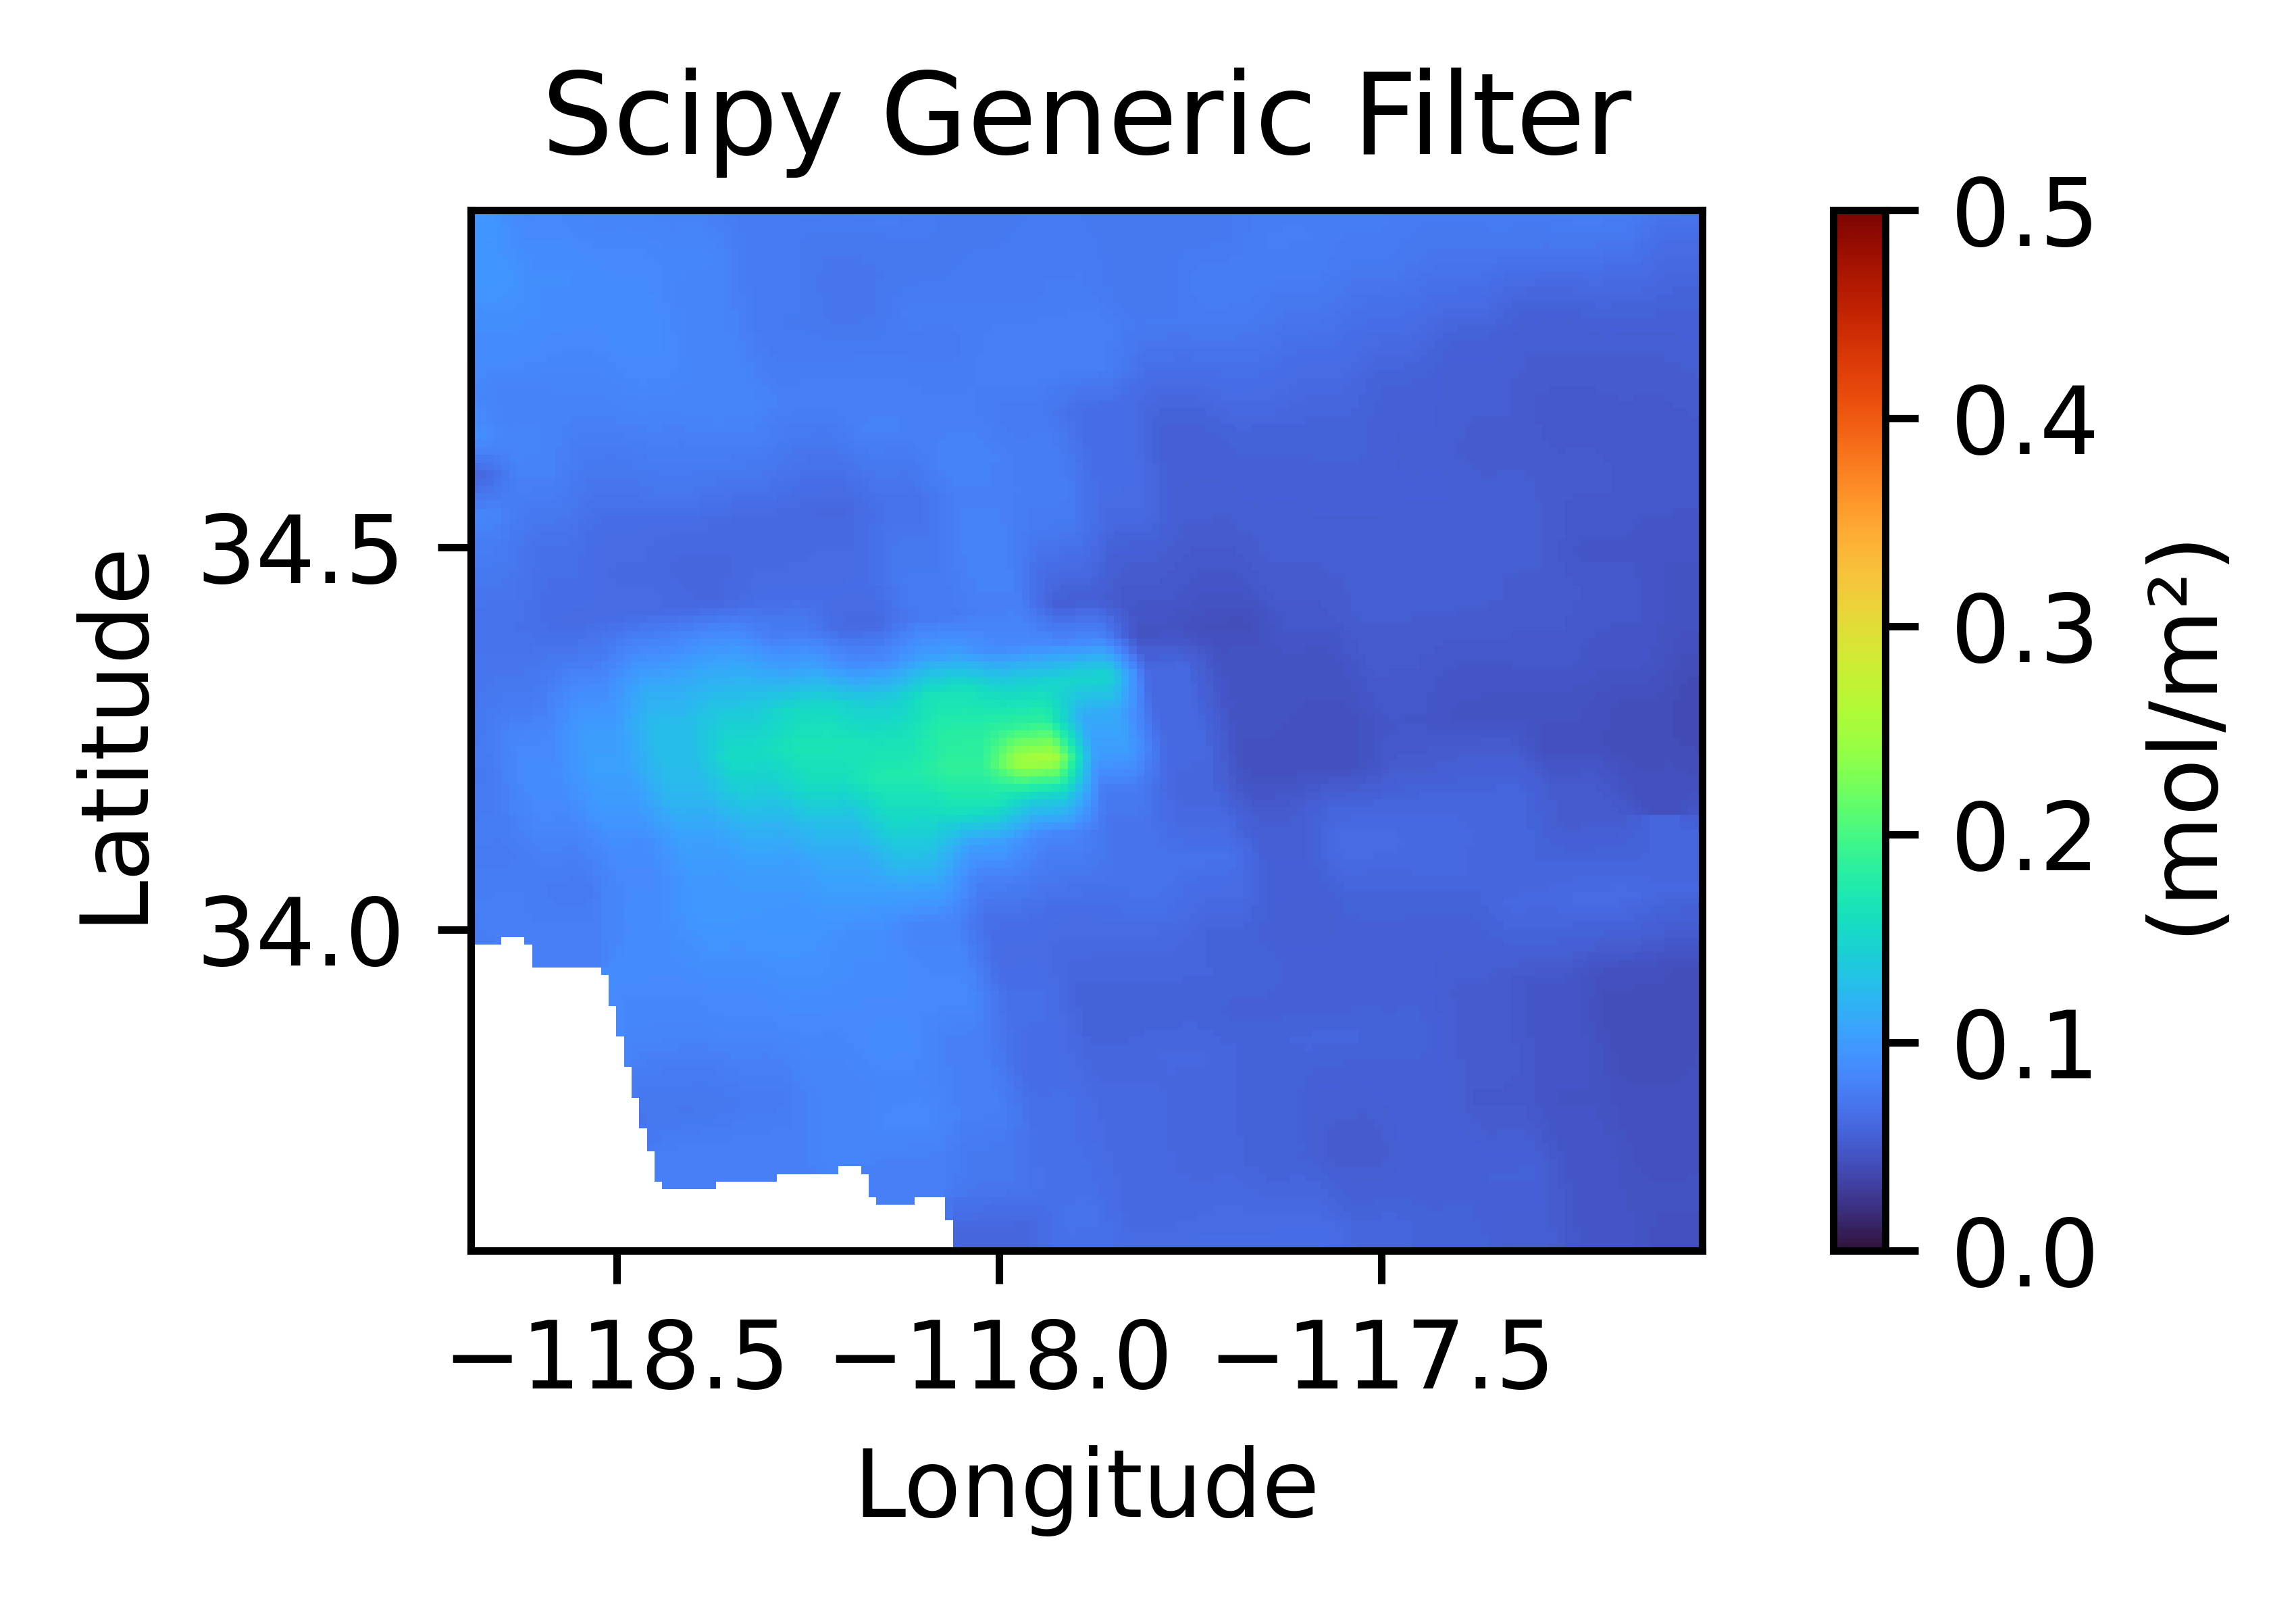
Applying Scipy Generic Filter
This is the fastest (computationally) filter to fill in missing gaps in the spatial data. It filled the center right hole, however, due to window size, it cannot fill the lower left corner gap.
import numpy as np
import rasterio
from scipy.ndimage import generic_filter
def fill_gaps(data, size=3):
def custom_filter(window):
valid_data = window[~np.isnan(window)]
if valid_data.size == 0:
return np.nan
return np.mean(valid_data)
return generic_filter(data, custom_filter, size=size, mode='nearest')
file_path = "/Users/braydennoh/Downloads/BOBCAT2020-09-11.tif"
with rasterio.open(file_path) as src:
data = src.read(1, masked=True)
data = data.astype(np.float32)
filled_data = fill_gaps(data, size=5)
fig, ax = plt.subplots(figsize=(5, 2))
cax = ax.imshow(filled_data, cmap=cmap, norm=norm, extent=(transform[2], transform[2] + transform[0] * data.shape[1],
transform[5] + transform[4] * data.shape[0], transform[5]))
ax.set_xlabel('Longitude')
ax.set_ylabel('Latitude')
def format_coord(x, y):
col, row = ~transform * (x, y)
return f"Longitude: {x:.4f}, Latitude: {y:.4f}"
ax.format_coord = format_coord
fig.colorbar(cax, ax=ax, label='(mol/m²)')
ax.set_title('Scipy Generic Filter')
ax.tick_params(axis="y",direction="out", left="off",labelleft="on")
ax.tick_params(axis="x",direction="out", left="off",labelleft="on")
ax.grid(False)
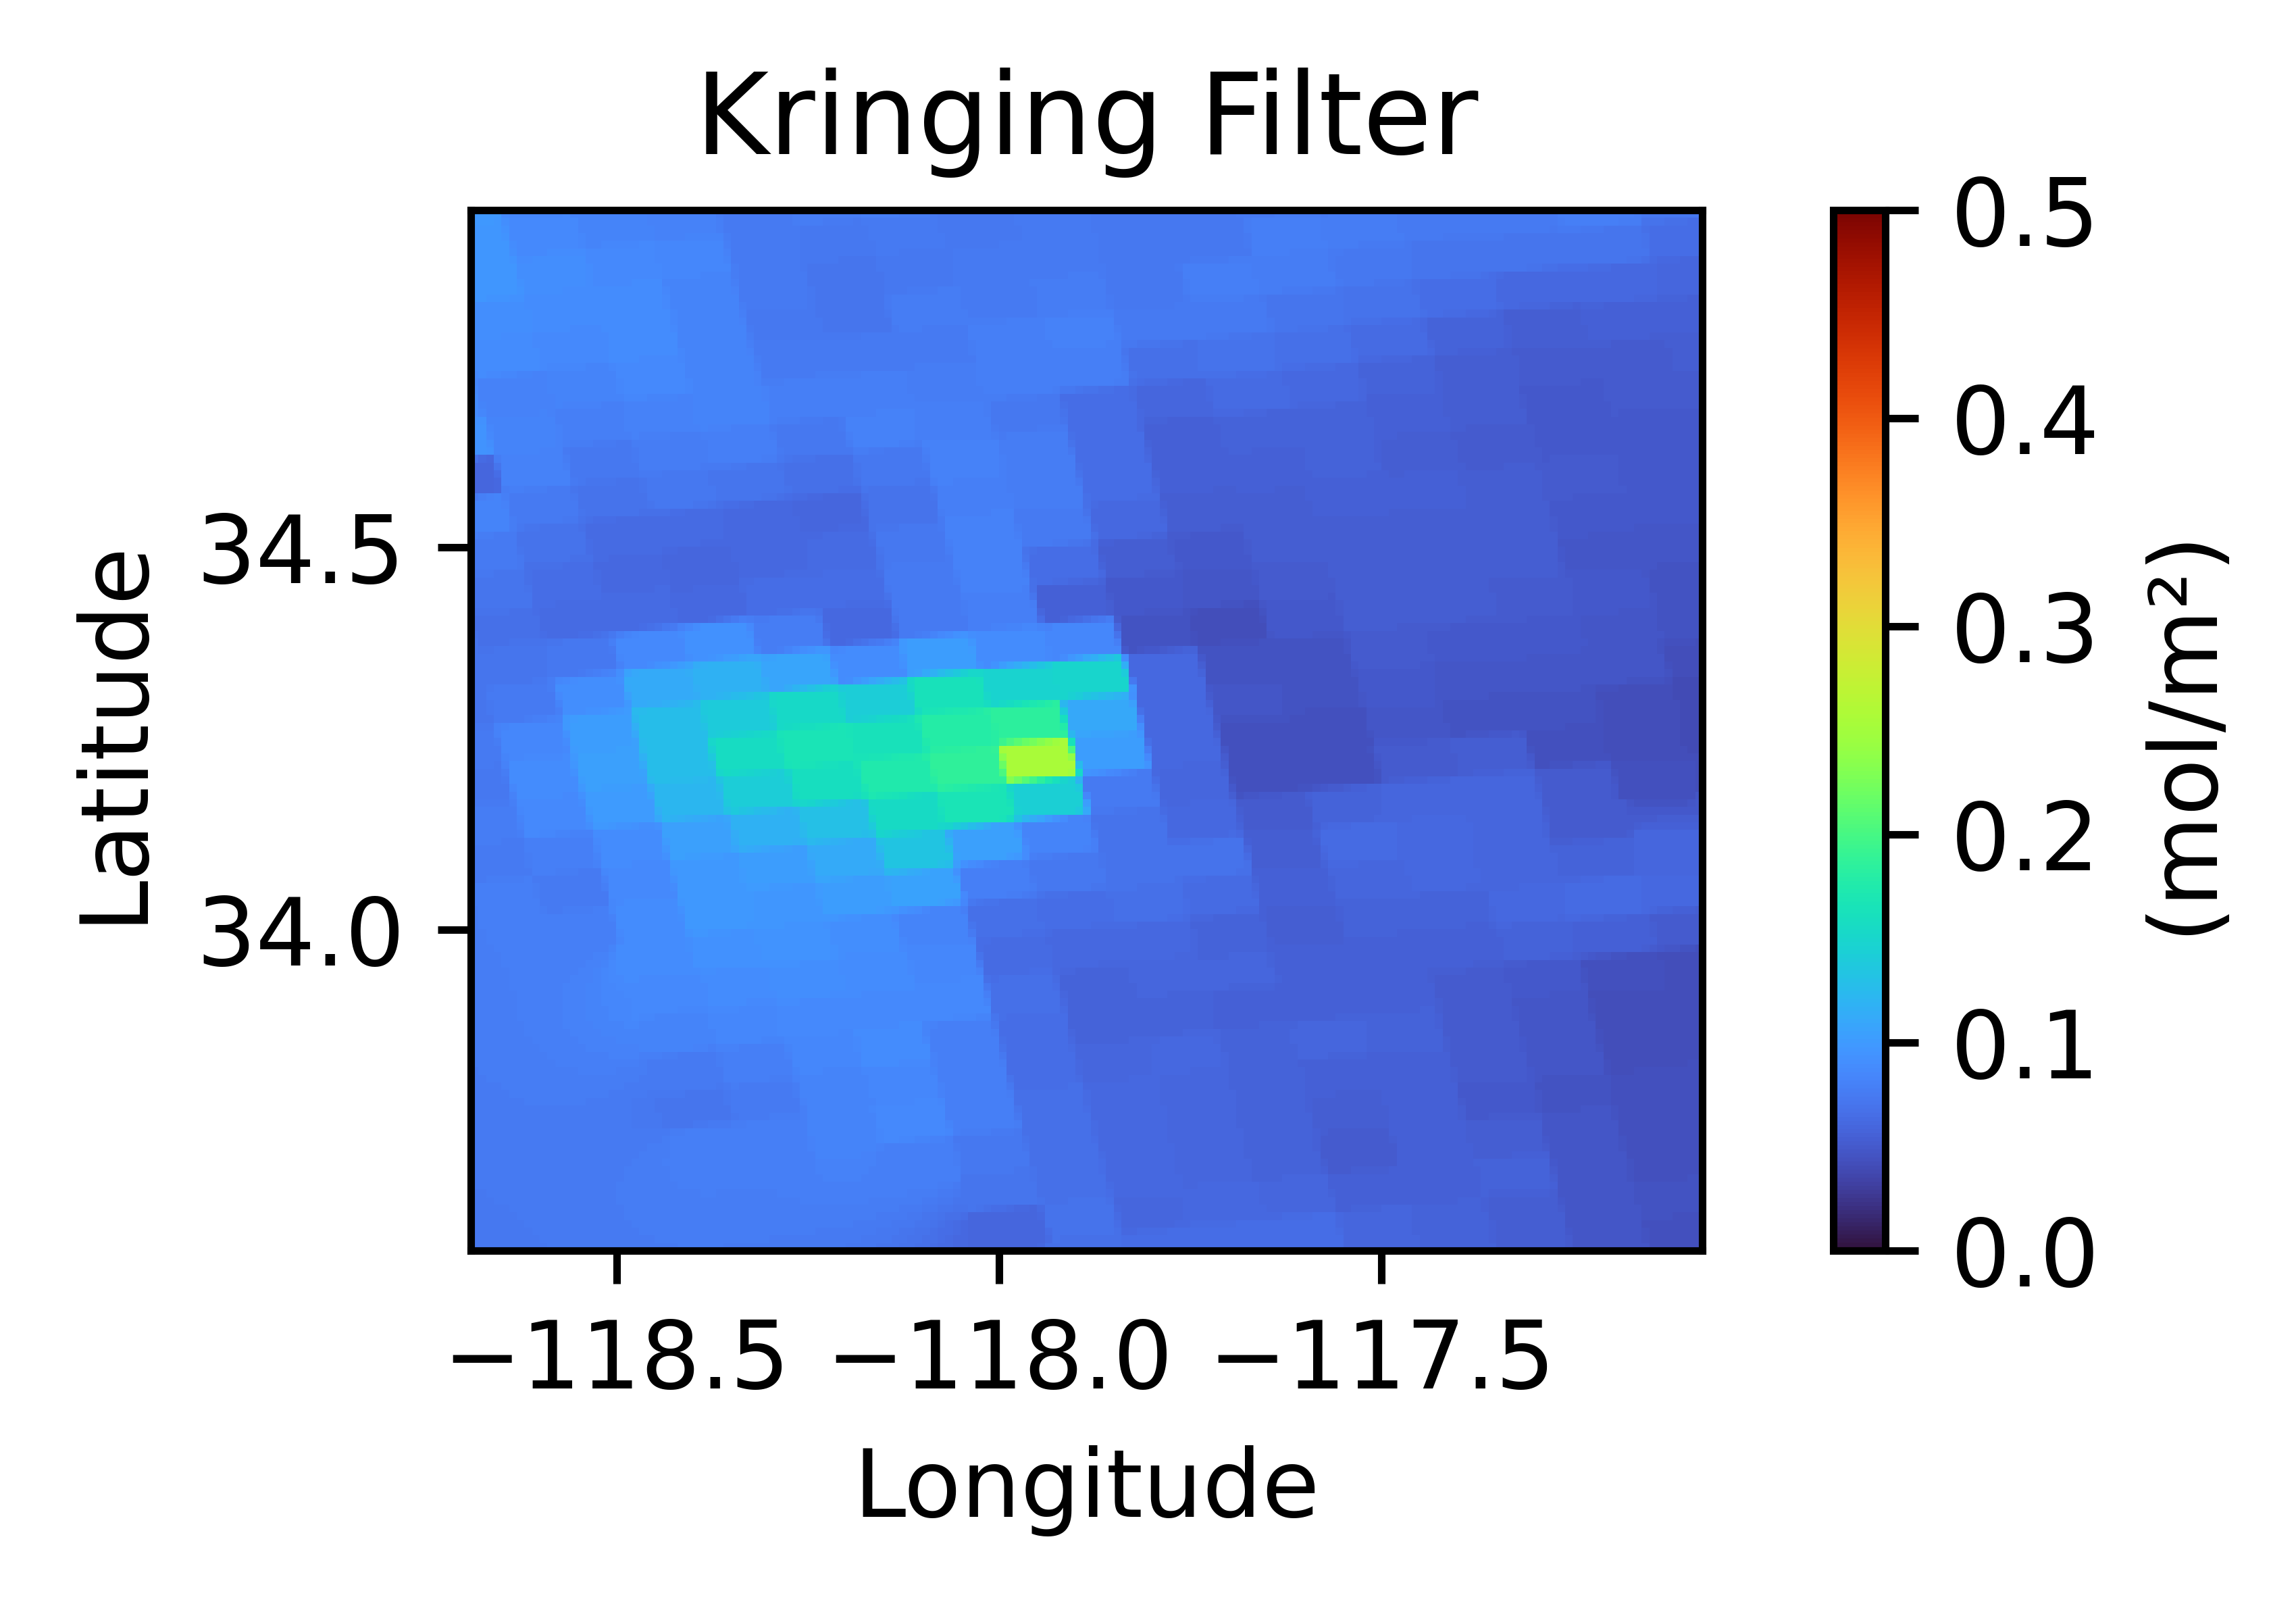
plt.show()Applying Kringing Filter
This is using PyKrige power model, which is the best filling method for my application.
import numpy as np
import rasterio
from pykrige.ok import OrdinaryKriging
import matplotlib.pyplot as plt

def perform_kriging(data, grid_x, grid_y):
    mask = ~np.isnan(data)
    values = data[mask].astype(float)
    x, y = np.meshgrid(grid_x, grid_y)
    coords = np.column_stack([x[mask].astype(float), y[mask].astype(float)])

    OK = OrdinaryKriging(
        coords[:, 0], coords[:, 1], values,
        variogram_model='power',
        variogram_parameters={'scale': 0.1, 'exponent': 1.5, 'nugget': 0.1},
        verbose=False, enable_plotting=False
    )
    z, ss = OK.execute('grid', grid_x.astype(float), grid_y.astype(float))
    return z

file_path = "/Users/braydennoh/Downloads/BOBCAT2020-09-11.tif"
with rasterio.open(file_path) as src:
    data = src.read(1, masked=True)
    data = data.astype(np.float32)

    grid_x, grid_y = np.arange(data.shape[1]), np.arange(data.shape[0])

    powerkriging = perform_kriging(data, grid_x, grid_y)